MassMapper User Guide
![]() MassMapper was created by the Bureau of Geographic Information (MassGIS) as a modern replacement for the long-used Oliver online mapping application. It provides access to virtually all the MassGIS map layers and associated descriptive information, which can be displayed and queried. Users can quickly create and share maps and download data for use in a Geographic Information System (GIS) or export tabular data as Excel or CSV files.
MassMapper was created by the Bureau of Geographic Information (MassGIS) as a modern replacement for the long-used Oliver online mapping application. It provides access to virtually all the MassGIS map layers and associated descriptive information, which can be displayed and queried. Users can quickly create and share maps and download data for use in a Geographic Information System (GIS) or export tabular data as Excel or CSV files.
*Please note: MassMapper is one of a family of applications, all built on the same template. Some of the other versions include MuniMapper that was created for Massachusetts Municipalities upon request. This user guide applies to all these applications, so you may substitute "MuniMapper," etc. for MassMapper as you read this guide.
Table of Contents
Getting started Tools Searching for a location Navigating the map Adding data layers Adding data layers by searching - New Features! Data layers with scale dependencies Reordering data layers Customizing data layers Customizing the map Removing data layers Viewing metadata Identifying features - using the single identify tool Identifying features - using the select by polygon tool Measuring length or area Drawing shapes and adding text - New Features! Creating a buffer - New Features! Copy coordinates - New Features! Creating an abutters list Bookmarking/sharing a map Zoom to a parcel - New Features! Downloading data - New Features! Saving a map as a PDF - New Features! Accessibility - New! Problems? Questions? Comments?Getting started
What do I need to run MassMapper?
MassMapper is run in a web browser. Currently, the application fully works in Google Chrome, Microsoft Edge, Mozilla Firefox, and Safari. The latest versions of these browsers are recommended. Other web browsers may also be able to run MassMapper.
Start MassMapper
You will see a splash screen with some introductory info. Click on ![]() to dismiss the splash screen.
to dismiss the splash screen.
![]() You may also choose to not see the splash screen again by checking this box. However, if MassGIS needs to post pertinent info about MassMapper, it will be posted on the splash screen and any changes to the text will force the splash screen to reappear.
You may also choose to not see the splash screen again by checking this box. However, if MassGIS needs to post pertinent info about MassMapper, it will be posted on the splash screen and any changes to the text will force the splash screen to reappear.
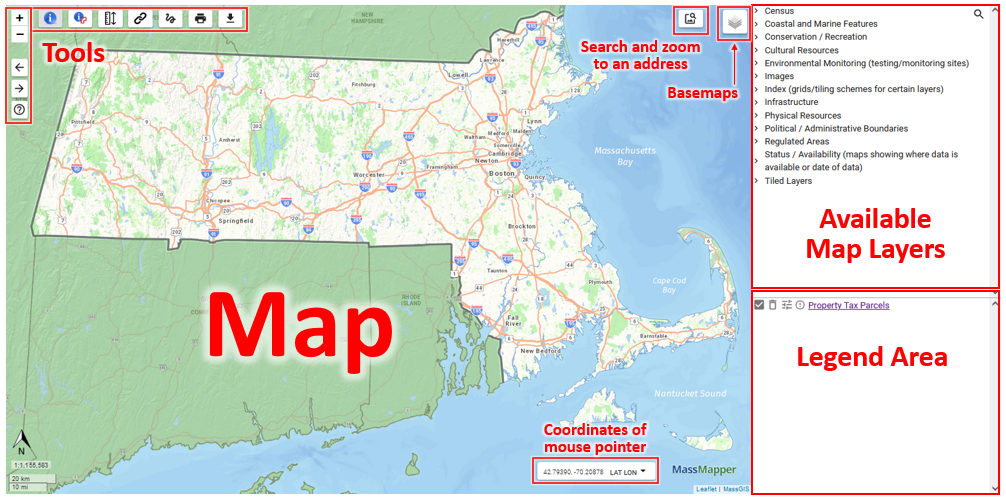
Initial view of the MassMapper application:
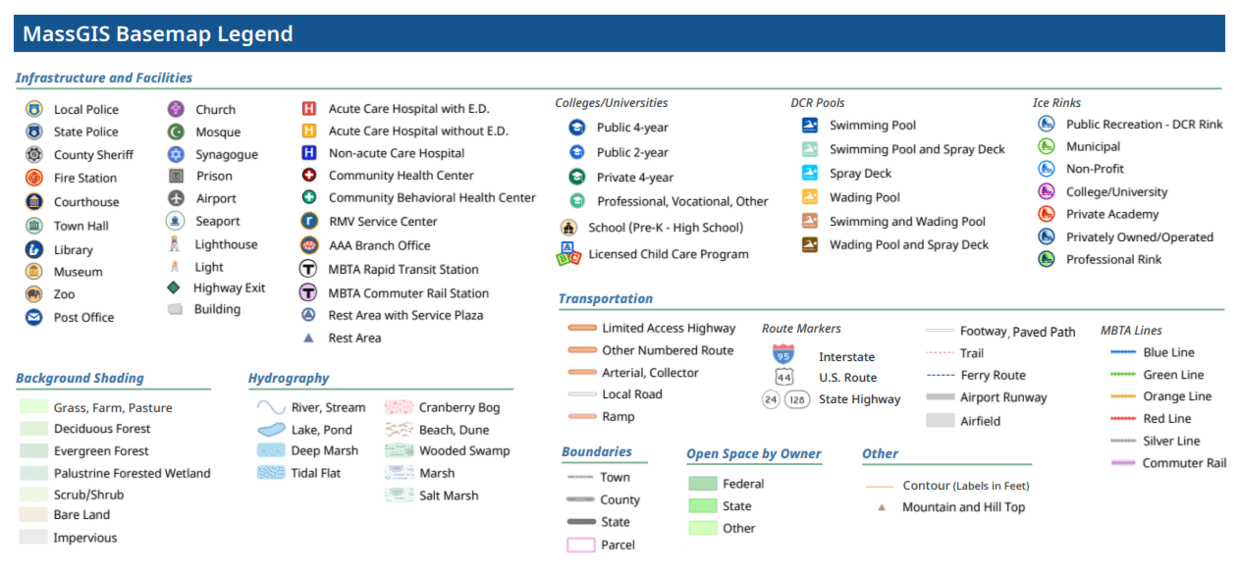
Legend for MassGIS Basemap
Tools
Please note: The Abutters List Tool is only displayed in MuniMappers.
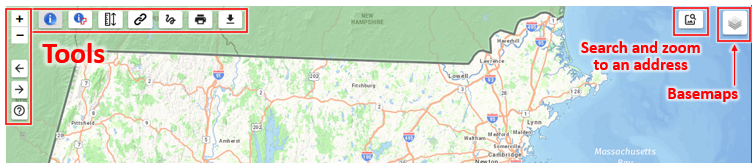
Tools at the top and the left side of the map
![]() Zoom in/Zoom out - Most navigation can be accomplished with a wheeled mouse. To move the map sideways (pan), simply hold your left mouse key down and drag to recenter the map. To zoom in, scroll your mouse wheel forward. To zoom out, scroll the wheel backward. If you do not have a wheel on your mouse, you will need to use these plus/minus tools. Or hold your shift key while dragging a box around a specific area to zoom in to.
Zoom in/Zoom out - Most navigation can be accomplished with a wheeled mouse. To move the map sideways (pan), simply hold your left mouse key down and drag to recenter the map. To zoom in, scroll your mouse wheel forward. To zoom out, scroll the wheel backward. If you do not have a wheel on your mouse, you will need to use these plus/minus tools. Or hold your shift key while dragging a box around a specific area to zoom in to.
![]() Go back to previous extent - Click this button to go back to the previous map extent.
Go back to previous extent - Click this button to go back to the previous map extent.
![]() Go to next extent - Click this button to go forward to the next map extent.
Go to next extent - Click this button to go forward to the next map extent.
![]() Help - Click this button to view this help documentation.
Help - Click this button to view this help documentation.
![]() Identify features by clicking on a feature - Click this tool then click on the map to identify features of active data layers that intersect the location you clicked. The identify results will appear in a pop-up window.
Identify features by clicking on a feature - Click this tool then click on the map to identify features of active data layers that intersect the location you clicked. The identify results will appear in a pop-up window.
![]() Identify features by drawing a shape - Click this tool then click on the map multiple times to draw a shape. Click on your starting point to close the shape. The identify results will appear in a pop-up window for all the features within your shape.
Identify features by drawing a shape - Click this tool then click on the map multiple times to draw a shape. Click on your starting point to close the shape. The identify results will appear in a pop-up window for all the features within your shape.
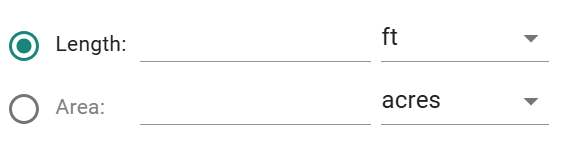
![]() Measure by length or area - Click this tool to view the measure menu. Click either radio button for Length or Area. Then using the dropdown menus, choose your units. Step by step details are further below.
Measure by length or area - Click this tool to view the measure menu. Click either radio button for Length or Area. Then using the dropdown menus, choose your units. Step by step details are further below.
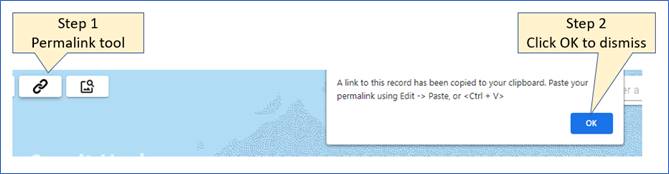
![]() Permalink - Click this tool to make a permalink for the map. A copy of the URL used to create the map you've constructed will be copied to your clipboard for pasting elsewhere.
Permalink - Click this tool to make a permalink for the map. A copy of the URL used to create the map you've constructed will be copied to your clipboard for pasting elsewhere.
![]() Abutters List - (Only available in City or Town based Municipal Mappers (MuniMapper)) Click this tool to launch the abutters list function. Enter a distance and select units (feet or meters) from the dropdown, then click on the subject parcel to get a list of abutters in the popup that can be exported as an Excel, CSV or Shapefile (for use in GIS software). You can grab and move the popup to see the buffer polygon used to select the abutters.
Abutters List - (Only available in City or Town based Municipal Mappers (MuniMapper)) Click this tool to launch the abutters list function. Enter a distance and select units (feet or meters) from the dropdown, then click on the subject parcel to get a list of abutters in the popup that can be exported as an Excel, CSV or Shapefile (for use in GIS software). You can grab and move the popup to see the buffer polygon used to select the abutters.
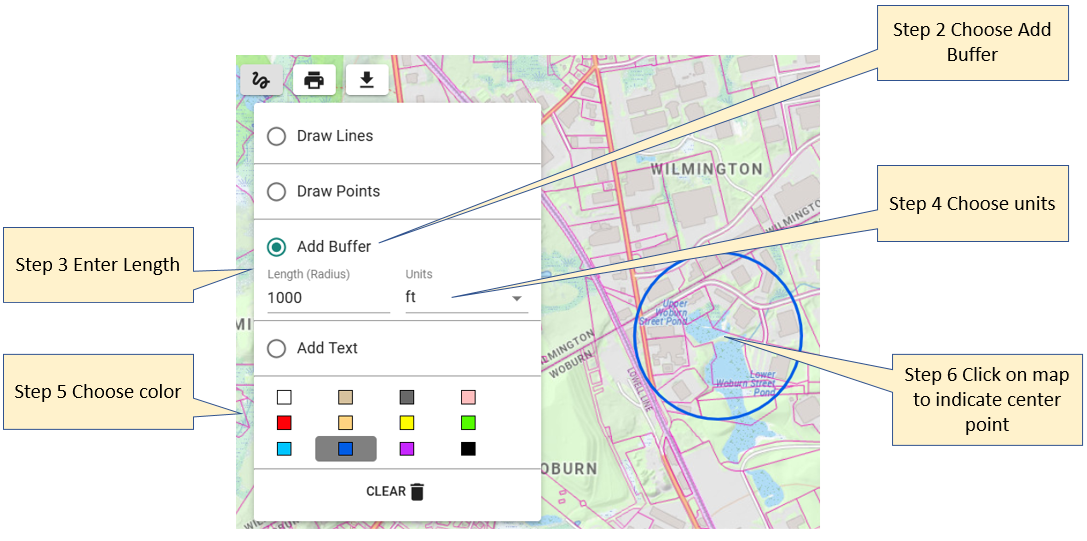
![]() Draw tools and Buffer - Click this tool to see several drawing options. You can draw a point, line or shape using the colors, styles and thicknesses presented. You can also add text to the map. A buffer circle can be drawn - enter a distance and select units (feet or meters) from the dropdown, then click on the map. These drawn features will not carry through in a permalink but will be on a map you print.
Draw tools and Buffer - Click this tool to see several drawing options. You can draw a point, line or shape using the colors, styles and thicknesses presented. You can also add text to the map. A buffer circle can be drawn - enter a distance and select units (feet or meters) from the dropdown, then click on the map. These drawn features will not carry through in a permalink but will be on a map you print.
![]() Print or save your map and legend as a PDF - Click this tool then enter the title that you want to appear on the top of your PDF map. You have the option of naming the PDF file. The default is massmapper.pdf. 2 page sizes are available. Click the print map button then the PDF will be downloaded to your Downloads folder.
Print or save your map and legend as a PDF - Click this tool then enter the title that you want to appear on the top of your PDF map. You have the option of naming the PDF file. The default is massmapper.pdf. 2 page sizes are available. Click the print map button then the PDF will be downloaded to your Downloads folder.
![]() Export data layers (for use in GIS) - Download zipped GIS files for the data layer features on your map for use in GIS software. Or export the tabular information.
Export data layers (for use in GIS) - Download zipped GIS files for the data layer features on your map for use in GIS software. Or export the tabular information.
![]() Enter a location - Type an address into the box and hit Enter. Click on the single result to zoom to the location. You can also search on city and town names, and in some cases, neighborhood names or major landmarks. This location feature is provided by MassGIS.
Enter a location - Type an address into the box and hit Enter. Click on the single result to zoom to the location. You can also search on city and town names, and in some cases, neighborhood names or major landmarks. This location feature is provided by MassGIS.
![]() Basemaps - Hover over this tool to see choices to change the basemap. The latest MassGIS aerial imagery will always be a choice. Use the layers from the Images folder to see older vintages of aerial photos. The opacity of basemaps can be changed. Some of the basemap choices may change over time.
Basemaps - Hover over this tool to see choices to change the basemap. The latest MassGIS aerial imagery will always be a choice. Use the layers from the Images folder to see older vintages of aerial photos. The opacity of basemaps can be changed. Some of the basemap choices may change over time.
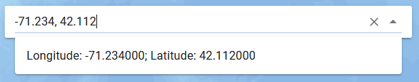
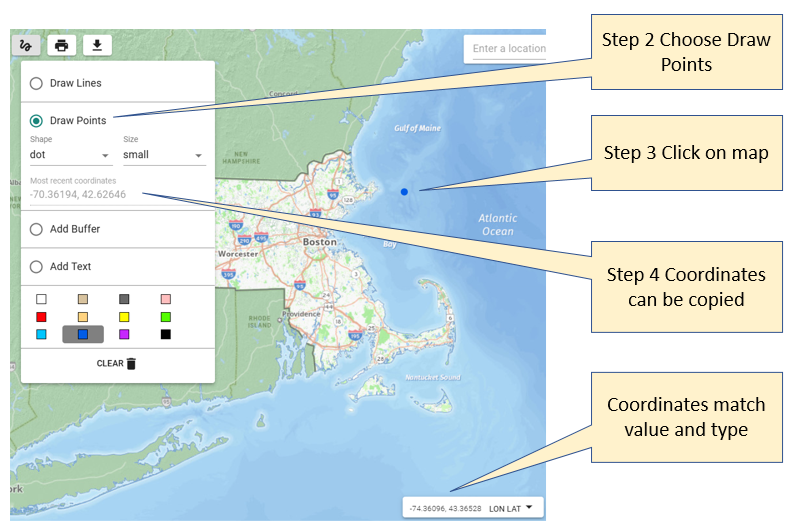
![]() Map units - You can choose to display map coordinates in four different ways; the default is Longitude/Latitude as Decimal Degrees (DD). Use the dropdown to change units to Longitude/Latitude as Degrees Minutes Seconds (DMS), MA State Plane Mainland Meters, or MA State Plane Mainland Feet. The coordinate shown changes as your mouse moves. The coordinate can be copied (for pasting) from the Draw tools / Draw Points section.
Map units - You can choose to display map coordinates in four different ways; the default is Longitude/Latitude as Decimal Degrees (DD). Use the dropdown to change units to Longitude/Latitude as Degrees Minutes Seconds (DMS), MA State Plane Mainland Meters, or MA State Plane Mainland Feet. The coordinate shown changes as your mouse moves. The coordinate can be copied (for pasting) from the Draw tools / Draw Points section.
Searching for a location

In the Enter a location box, type in any of the following:
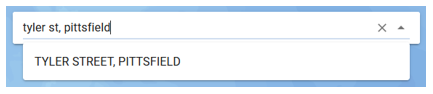
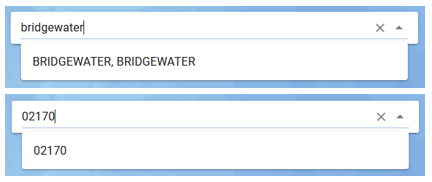
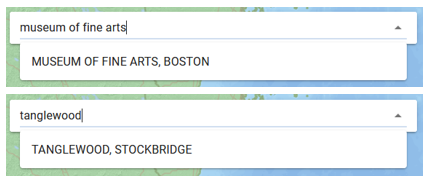
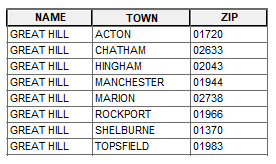
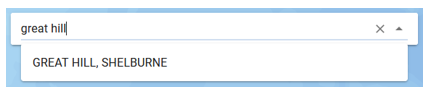
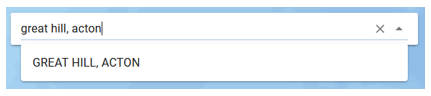
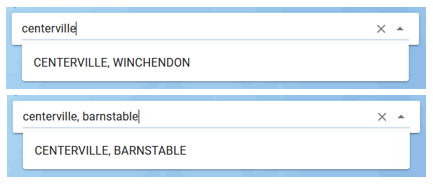
Then hit Enter on your keyboard. For addresses, enter the number, street name, and city/town or ZIP Code: An address without a city/town may not return a match: You can also enter a street name and city/town without a house number: And you can enter a city/town name or 5-digit ZIP Code by themselves: For well-known placenames with unique names, community may not be required: For placenames with non-unique names, enter a city/town or ZIP Code to be sure you get the correct result. For example, there are several Great Hills in Massachusetts: If you enter "Great Hill" alone, the tool will randomly pick one (in this case the one in Shelburne): By entering "Great Hill, Acton" the tool will return that specific result: Similarly for villages and neighborhoods, the name may not be unique. For example, there is more than one Centerville. Entering that name alone found the one in Winchendon. To find the one on Cape Cod, include the official municipality name of Barnstable: For longitude and latitude, longitude must be first and include a minus sign, and be followed by a comma: To provide this service MassGIS collected information from many of the existing datalayers in its catalog, such as schools, colleges, prisons, hospitals, historic buildings, town halls, etc. In addition, data from OpenStreetMap was collected which enhances the service with additional detail such as businesses. To zoom to a very specific area, hold the shift key while dragging a box by holding your left mouse key to define a box to zoom into.
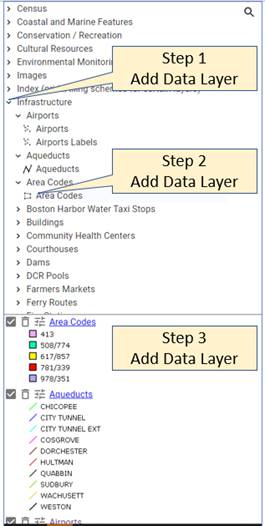
If you simply click in the Search for a layer window, you will see an alphabetical listing of available data layers that you can scroll through, click on a layer of interest to have it render.
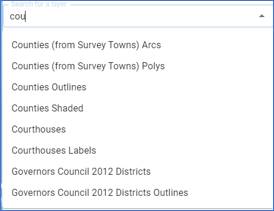
Or you can start typing search terms. The MassGIS datalayer web page lists all available layers. The category sections on that page loosely mirror the section categories in MassMapper. In the example below, Counties is being called for.
Most data layers have scale dependencies and are only visible within certain scale ranges, such as less than 1:100,000. If a data layer has a scale dependency and the map is not within the appropriate scale range, the data layer will not draw on the map and this icon Data layers are drawn from the bottom to the top of the Legend Area, and they appear layered in that order on the map. To reorder the data layers, click on a data layer name in the Legend Area, hold down the mouse button, and drag the data layer name up or down in the list. After adding a data layer, you will see the Customize Layer Settings button Symbology: MassGIS has created sensible legends for each data layer. However, the user can change the color of point, line, or polygon data layers in the legend area. Click a data layer's settings icon
in the legend area, move the mouse cursor over "Custom Color" and select a color option. Points will be drawn as squares in the color you selected, lines will be drawn with the color you choose, and polygons will be drawn with a gray outline and filled in with the color you picked. Keep in mind that there is no way to use different colors for different features in the same layer; either use the default legend that may have many colors or select your own single color.
Map units: When the cursor is over the map, the longitude and latitude of the cursor's location are displayed in the lower right-hand corner of the map. To change the units of the longitude and latitude, click the dropdown on the Map units bar in the lower right to view a menu and select one of the listed options.
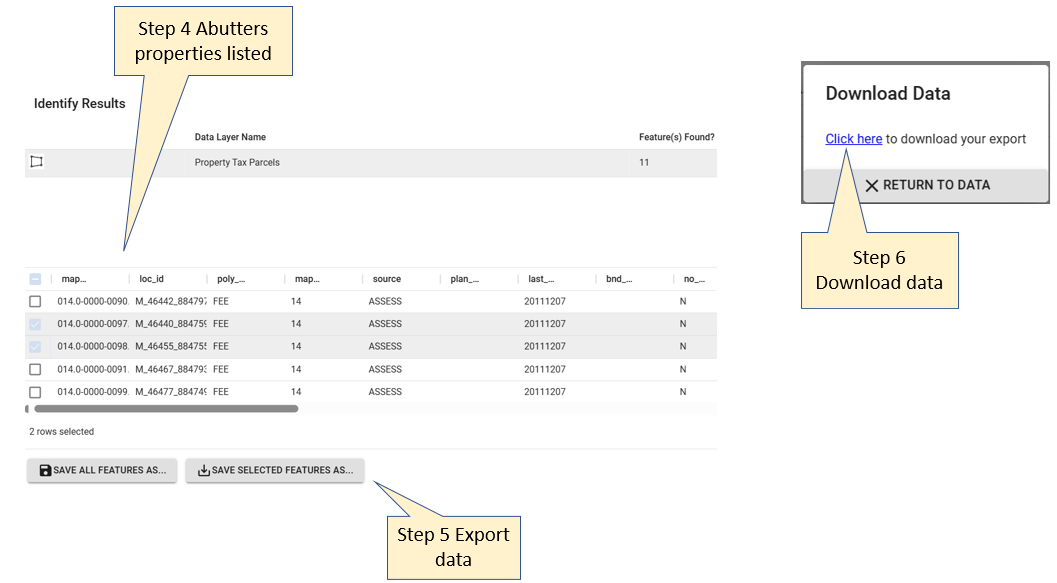
Metadata is text documentation about a data layer and is available for virtually all data layers in MuniMapper. To view a data layer's metadata, click the hyperlinked name of the layer once you have added it to the legend area. This tool is used to click a feature on the map to see the details (textual description) of that feature. This tool will only identify layers in the legend area and will not identify features in any basemap as the basemap is merely a picture. Click the "Click to identify a feature" tool. This tool is used to draw a shape around features of interest to see the details (textual description) of those features in a table. The tool will only identify layers present in the legend area and will not identify features in any basemap as the basemap is merely a picture. The abutters list tool is available only in Municipal Mappers and will generate a list of property owners within a certain distance that you input. The list can be exported as Excel, CSV, and Shapefile formats. Navigate to your property of interest. The only default data layer, Property Tax Parcels should appear. For clarity, remove any other layers. *Users should be aware that in the case of multiple owners on a single condo property, only one property parcel may be selected but the multiple owners will be listed in the abutters list results. A single parcel with multiple condo owners will be a darker orange color, whereas parcels with single owners will be a more transparent orange. It's possible to create a URL that will zoom immediately to a parcel when MassMapper is launched. To add zoom to a parcel functionality to a simple MassMapper URL (non Permalink), use ?locid=value The locid is a unique parcel identifier. If the URL is a full Permalink, the locid will override any bounding box "b" parameter in the URL. The locid parameter needs to be preceded by a question mark if it is the only parameter on the URL, otherwise it needs to be preceded by an ampersand. This is standard URL parameter syntax. Note: if the locid value cannot be found in the parcel datalayer, MassMapper will zoom to a statewide extent. Examples:
or
https://maps.massgis.digital.mass.gov/MassMapper/MassMapper.html?bl=MassGIS%20Basemap__100&l=Basemaps_L3Parcels____ON__100&b=-70.2513885498047,42.0434606003212,-70.18959045410158,42.07143675906666&locid=F_774471_2956366
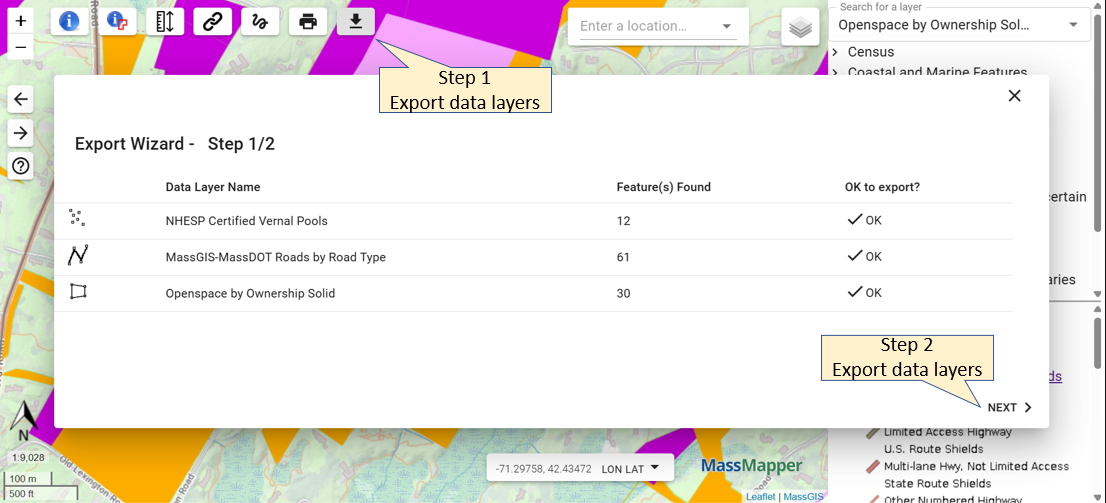
This tool is useful for downloading small areas of data layers in various formats for use in mapping software, or to simply get the tabular attribute data. If you need data layers for larger areas, we recommend downloading the statewide data layers.
In the final pane, click on the Download box and the file will be placed in your Downloads folder. Before saving a map, use the trash can icon to remove any default data layers or any you may have added that you do not need or have simply checked off. This will help to save space for the legend; especially if you have a long legend which may be saved as a second page of your PDF depending upon the length of the legend.
The single, best result will appear. Click on that to zoom to the location. Text may be entered in lower, upper, or mixed case. All results are in Massachusetts and "MA" should not be included for best results. Some misspellings are tolerated.
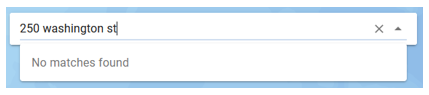
If no result is close enough, "No matches found" will appear.
*** To improve the chances that you will get your desired result, include the city/town name or ZIP Code for common addresses and place names that may be duplicated in multiple communities.
Here are some examples: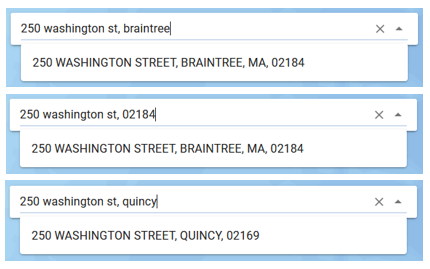
If you find something missing from the location service that should be included in a MassGIS datalayer let us know. If the missing item is not a MassGIS datalayer, we suggest that you include it in the OpenStreetMap project and when our service is next updated, it will be harvested by us. If you're not sure, let us know.Navigating the map
![]()
![]() Most navigation can be accomplished with a wheeled mouse. To pan, simply hold your left mouse button and drag to recenter the map. To zoom in, scroll your mouse wheel forward. To zoom out, scroll the wheel backward. If you do not have a wheel on your mouse, you will need to use the plus/minus tools.
Most navigation can be accomplished with a wheeled mouse. To pan, simply hold your left mouse button and drag to recenter the map. To zoom in, scroll your mouse wheel forward. To zoom out, scroll the wheel backward. If you do not have a wheel on your mouse, you will need to use the plus/minus tools.
![]() Go back to previous extent - Click this button to go back to the previous map extent.
Go back to previous extent - Click this button to go back to the previous map extent.![]() Go to next extent - Click this button to go forward to the next map extent.
Go to next extent - Click this button to go forward to the next map extent.
Adding data layers
![]()
![]() , lines
, lines ![]() , or polygons
, or polygons ![]() , or rasters (tiles).
, or rasters (tiles). ![]()
Adding data layers by searching
![]()
![]() In the upper right, click in the Search for a layer box. New: The box now stays open at all times so it is more visible.
In the upper right, click in the Search for a layer box. New: The box now stays open at all times so it is more visible. 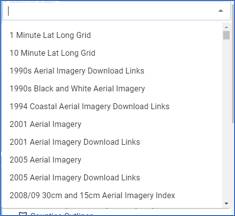
Data layers with scale dependencies
![]()
![]() will appear next to the layer name. To view the data layer, zoom in. Some of the basemaps
will appear next to the layer name. To view the data layer, zoom in. Some of the basemaps ![]() also have scale dependency and will be dimmed/unavailable at small scales (zoomed way out) and you'll need to zoom in and then add that basemap.
also have scale dependency and will be dimmed/unavailable at small scales (zoomed way out) and you'll need to zoom in and then add that basemap.
Reordering data layers
![]()
Customizing data layers
![]()
![]() , click that to expose several functions related to that layer.
, click that to expose several functions related to that layer.
Opacity Slider:
The opacity (solid to transparent) of active data layers may be changed. Preceding the layer name, click the opacity slider
![]() , hold down the mouse button on the green dot, and drag the slider to the desired opacity. The percentage of opacity will appear in the green pin and will appear on your map once you release the mouse. Data layers with 0% opacity will be completely transparent and data layers with 100% opacity will be opaque.
, hold down the mouse button on the green dot, and drag the slider to the desired opacity. The percentage of opacity will appear in the green pin and will appear on your map once you release the mouse. Data layers with 0% opacity will be completely transparent and data layers with 100% opacity will be opaque.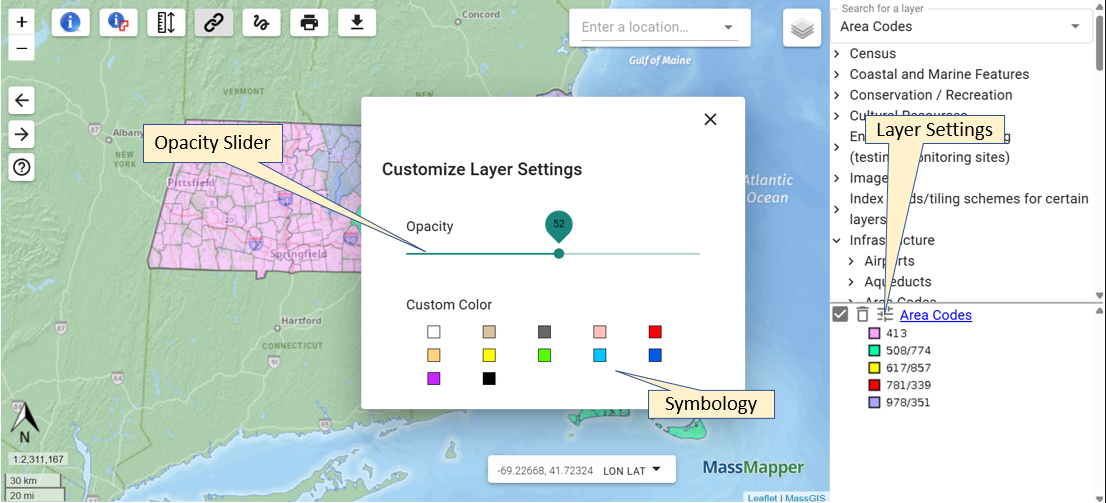
Customizing the map
![]()
![]()
Basemaps: To change the basemap, hover over the "Basemaps" button ![]() in the upper right to view a menu and select one of the listed options. This map will always appear below any other added data layers and can only be removed by selecting a different basemap. A dimmed basemap title in the list indicates it is scale dependent and you'll need to zoom in to see it. The opacity of the basemap can be changed by using the slider. Depending upon availability, the options may change over time.
in the upper right to view a menu and select one of the listed options. This map will always appear below any other added data layers and can only be removed by selecting a different basemap. A dimmed basemap title in the list indicates it is scale dependent and you'll need to zoom in to see it. The opacity of the basemap can be changed by using the slider. Depending upon availability, the options may change over time.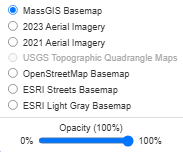
Removing data layers
![]()
![]() To temporarily turn a data layer off, uncheck the box next to the data layer name in the legend area window.
To temporarily turn a data layer off, uncheck the box next to the data layer name in the legend area window.![]() To remove a data layer, click the trash can icon next to the layer name.
To remove a data layer, click the trash can icon next to the layer name.
Viewing metadata
![]()
Identifying features - using the single identify tool
![]()
![]() Click on the identify a feature tool, then click on the map to identify features of added data layers that intersect the location you clicked.
Click on the identify a feature tool, then click on the map to identify features of added data layers that intersect the location you clicked.![]() will appear next to the layer name legend area.
will appear next to the layer name legend area.![]() .
.
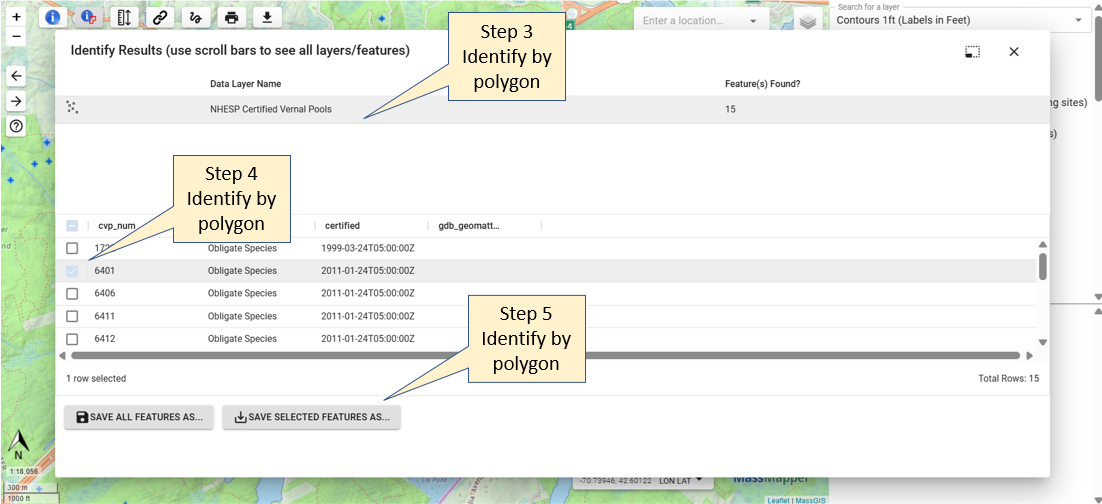
Identifying features - using the select by polygon tool
![]()
![]() Click on the draw a polygon tool. In the map use your cursor to click multiple times to draw a shape around your features of interest and close the shape by clicking back on the first point.
Click on the draw a polygon tool. In the map use your cursor to click multiple times to draw a shape around your features of interest and close the shape by clicking back on the first point.![]() will appear next to the layer name legend area.
will appear next to the layer name legend area.![]() .
.
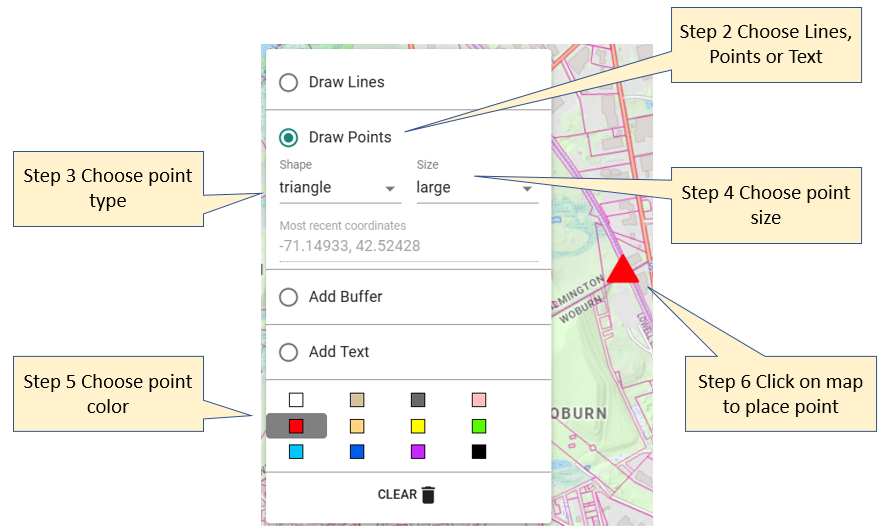
Drawing shapes and adding Text
![]()
![]() Click the "Draw" tool. The following popup will appear.
Click the "Draw" tool. The following popup will appear.
Creating a buffer
![]()
![]() Click the "Draw" tool. The following popup will appear.
Click the "Draw" tool. The following popup will appear.
Copy coordinates
![]()
![]() Click the "Draw" tool. The following popup will appear.
Click the "Draw" tool. The following popup will appear.
Measuring length or area
![]()
![]() Click the "Measure" tool. Select the radio button for Length or Area. The following popup will appear.
Click the "Measure" tool. Select the radio button for Length or Area. The following popup will appear.
Creating an abutters List
![]()
![]() .
.![]() .
.
Bookmarking/Sharing a Map
![]()
![]()
Please note: Some software programs, such as Microsoft Outlook, limit the number of characters allowed in a URL. If the permalink URL exceeds the maximum allowed length, the link will not open automatically when clicked. Copy and paste the URL into a web browser to open it. Also, if you used the draw tools to add text or lines, those will not carry over in the permalink. Use the print as PDF tool if you need text or lines to be saved.
Zoom to a parcel
![]()
https://maps.massgis.digital.mass.gov/MassMapper/MassMapper.html?locid=F_774471_2956366
The value to use for the locid parameter can be found by clicking on a parcel in MassMapper. The table will show the LOC_ID attribute in the table.
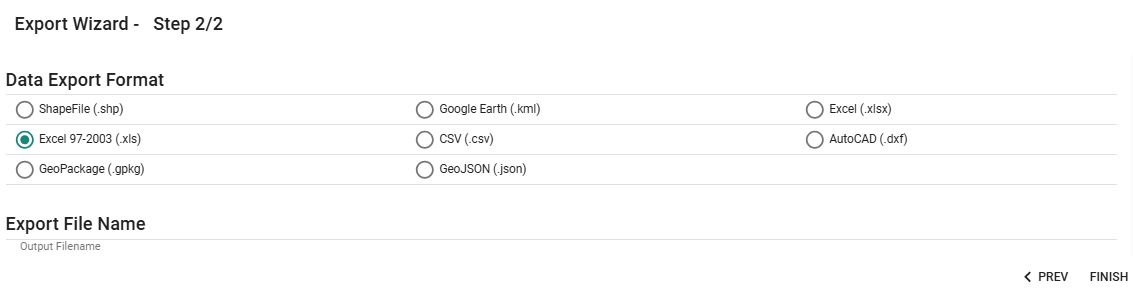
Downloading data using the export data layers tool
![]()
![]() Click the "Export data layers" tool.
Click the "Export data layers" tool.
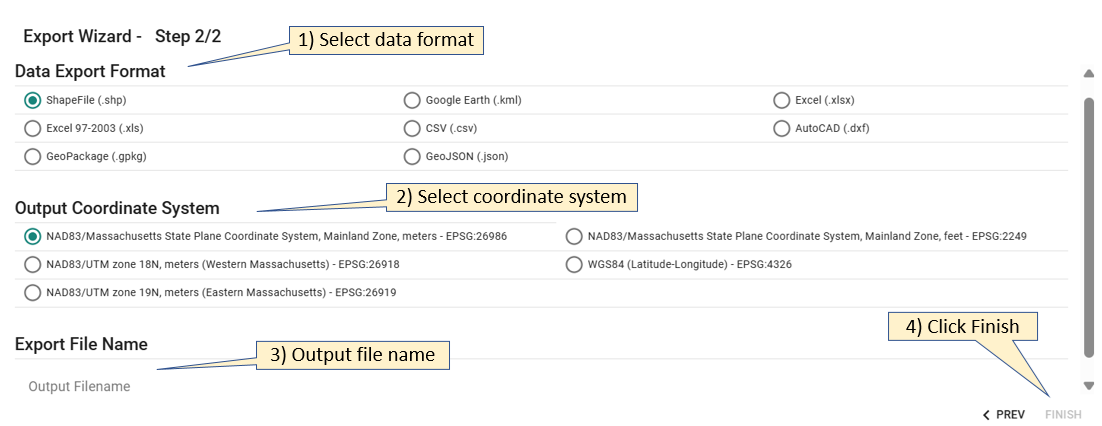
1) Choose the data format (the default is Shapefile). New: AutoCAD version 14 .dxf or GeoPackage or GeoJSON. (Note: .dxf is geometry only, no attributes)
2) Choose the coordinate system (the default is NAD83 MA Stateplane Meters, as this is how all MassGIS data are stored). New: NAD83 MA Stateplane Feet
3) Input a file name (note: spaces will be converted to underscores)
4) Click Finish.
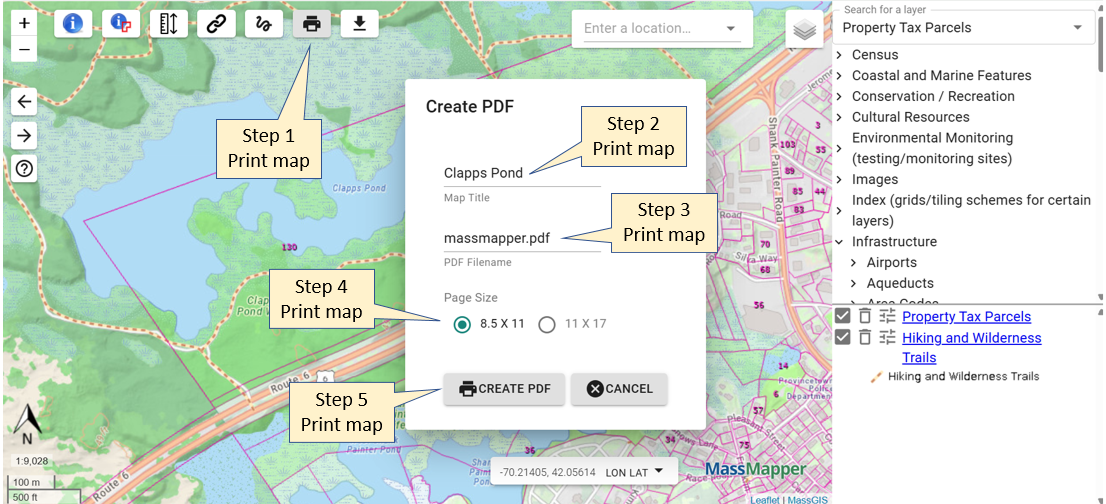
Saving a map as a PDF
![]()
).
![]() Click the "Print map" button.
Click the "Print map" button.
New: The PDF will have the date included in the lower left.
Problems? Questions? Comments?
Please report problems and give feedback
If you notice any bugs in the application or think that something should be explained better in this help document, please Contact MassGIS.

Accessibility
MassGIS is actively working to add accessibility improvements to MassMapper. These improvements will be deployed by spring 2026. While the improvements are in progress, MassGIS would like to note several ways of using MassMapper that are helpful for accessibility:
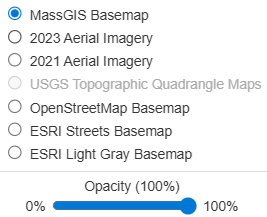
While MassMapper opens with a detailed colorful custom basemap using MassGIS data, other basemap choices are available. One option is the ESRI Light Gray Basemap. This background is muted and allows other data drawn on top to stand out visually.
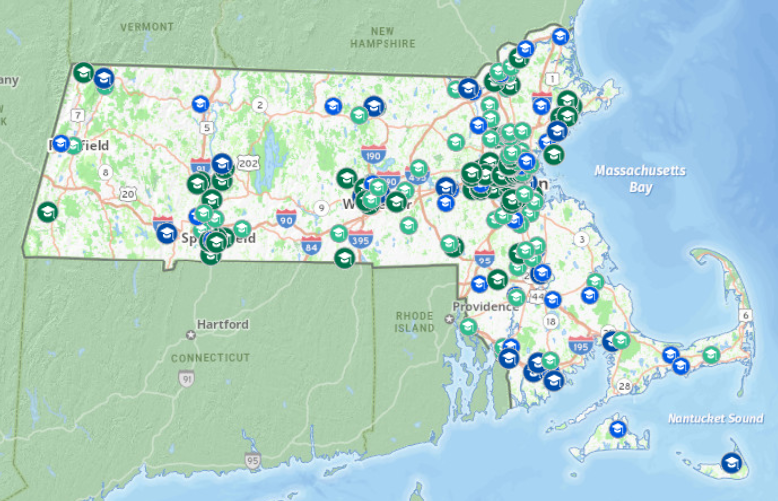
Default colorful basemap at default opacity (100%), with colleges drawn on top in several different shades of green and blue.
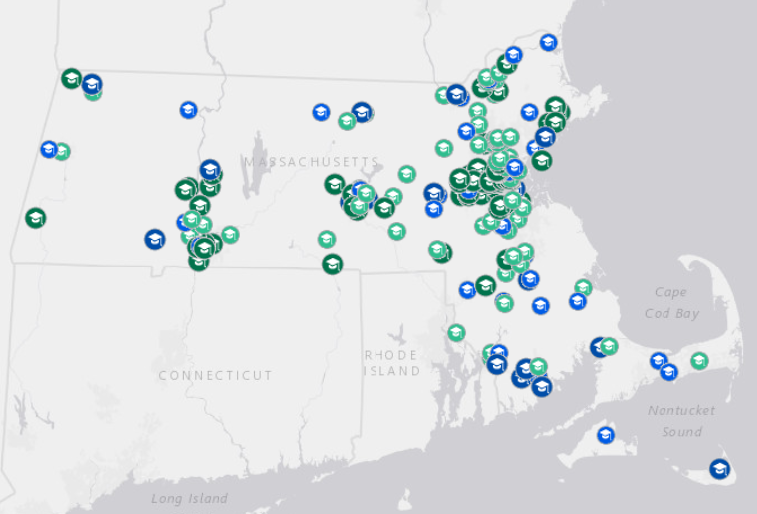
ESRI Light Gray basemap at default opacity (100%), with colleges drawn on top in several different shades of green and blue.
In addition, each basemap can be altered for its opacity (or opposite, transparency) setting.
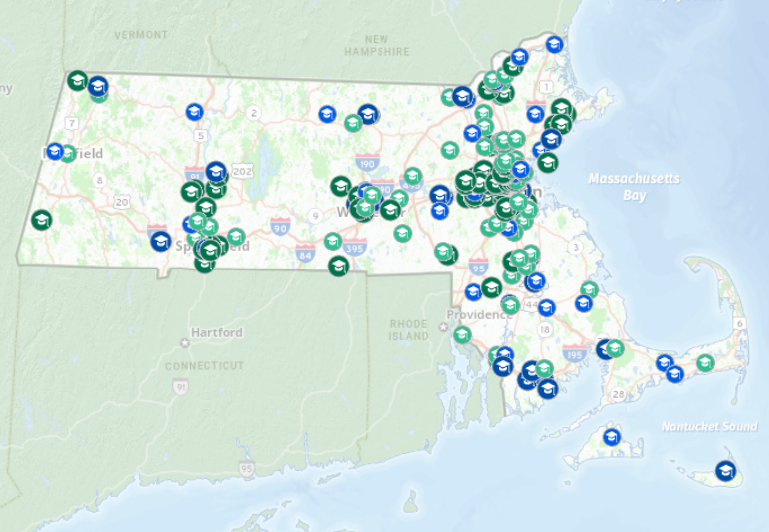
Default colorful basemap at default opacity (50%), with colleges drawn on top in several different shades of green and blue.
Just as basemaps can have their opacity changed, datalayers can have their opacity changed.
For example, adding the Ecosystems layer over the default basemap blocks out all the basemap details:
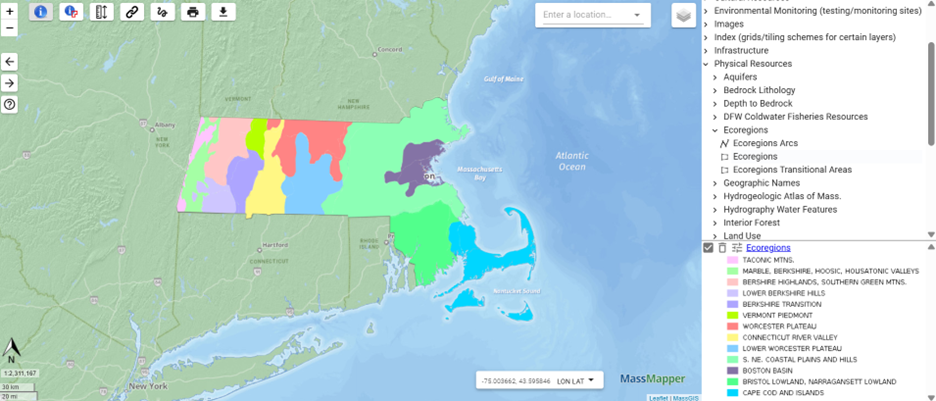
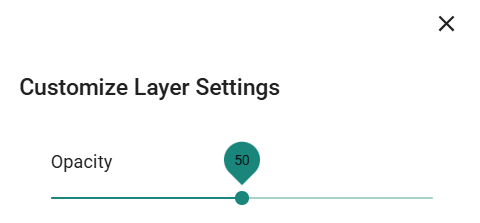
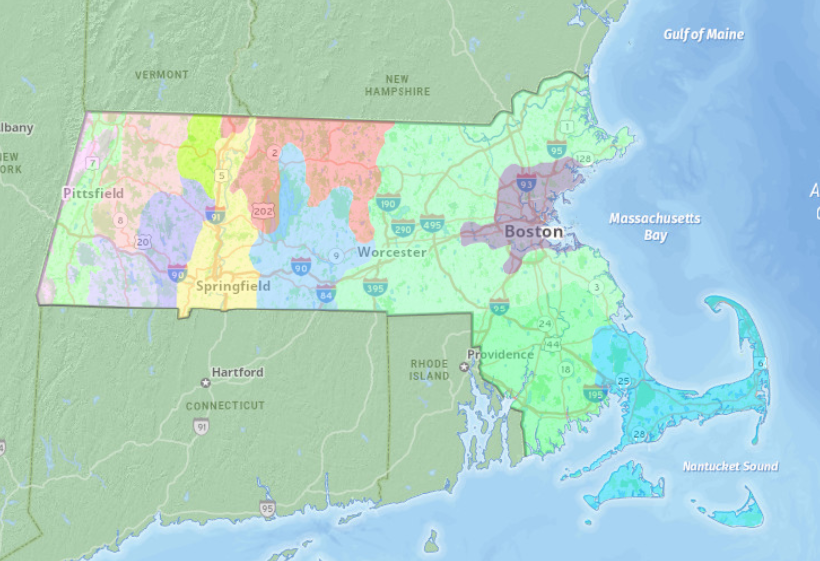
By clicking on the Customize Layer Settings icon to the left of the datalayer name in the legend area, it is possible to change the default opacity of 100% for the Ecoregion layer to a different value (that is more transparent).
If a datalayer’s color symbology conflicts with another datalayer’s colors or the basemap, the datalayer’s color can be changed.
For example, if prisons are displayed on top of the ESRI Light Gray basemap the default gray symbol is difficult to see.
Click the "Customize Layer Settings" button in the legend
Choose a color. Features in the layer will all be the same color squares.
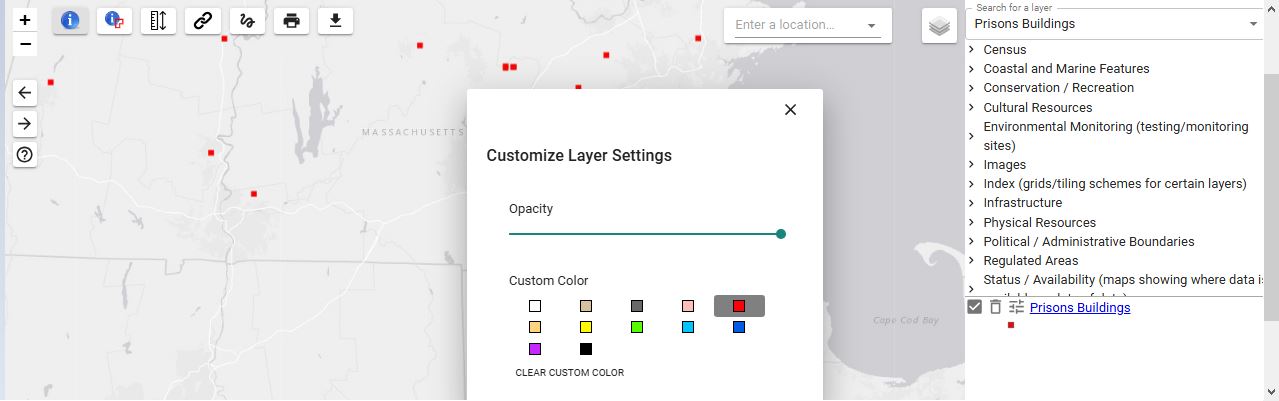
Click "Clear Custom Color" in the dialog to return to the default symbology.
Sometimes it is easier to work with data in tabular format then as a map. It is possible to download limited amounts of data from MassMapper in Excel, CSV or JSON formats. Add the datalayer to the map, then click the download button.
If too many features are selected zoom in. Otherwise, click Next and then choose a download format.
11/10/2025